
How Trend Seeker's Evidence-First Opportunity Score Works
A technical walkthrough of Opportunity Score v3: signal quality, independent evidence, source identity, recency decay, search momentum, competition, confidence, and the inputs we removed.
12 min read

Introduction
Trend Seeker's Opportunity Score now comes from observed market evidence, not a first-pass AI opinion about whether an idea sounds buildable. Version 3 combines signal quality, evidence depth, independent source breadth, search momentum, and competition. It also shows the evidence and arithmetic behind the result in the idea UI?.
The main change is conceptual. A plausible generated idea is not evidence. A detailed AI response is not demand. Volume, urgency, and specificity are useful labels when reading an idea, but they should not silently stand in for verified, recent source material.
The new score therefore starts lower in the pipeline. It reads the qualifying Reddit posts, app reviews, job ads, podcast passages, and other demand records attached to an idea. It deduplicates them, identifies their real sources, discounts old observations, and only then calculates a score.
The formula
Every input is normalized to a value between zero and one. The final score is the weighted sum:
opportunity = 0.40Q + 0.15D + 0.10B + 0.15T + 0.20C
| Input | Weight | What it measures | What it does not measure |
|---|---|---|---|
| Signal quality (Q) | 40% | Mean adjusted quality of the five strongest independent demand signals. | Raw mention volume. |
| Evidence depth (D) | 15% | Log-scaled count of independent signals after recency decay. | Ten duplicate copies as ten new observations. |
| Source breadth (B) | 10% | Log-scaled count of independent authors, companies, feeds, speakers, or reviewers. | The number of source categories alone. |
| Search trends (T) | 15% | Recent search momentum, with the same 60-day recency decay. | Absolute search volume or revenue. |
| Competition opportunity (C) | 20% | Validation from a few relevant competitors, reduced when the market looks crowded. | A generic reward for having zero known competitors. |
flowchart LR
  Q[Signal quality<br/>40%] --> S[Opportunity score<br/>0 to 100]
  D[Evidence depth<br/>15%] --> S
  B[Independent sources<br/>10%] --> S
  T[Search trends<br/>15%] --> S
  C[Competition opportunity<br/>20%] --> S
  X[AI market buildability] -. excluded .-> R[Not scored]
  Y[Legacy urgency and specificity] -. excluded .-> R
The formula has five measured inputs. AI market buildability, urgency, and specificity do not contribute points. Diagram: Trend Seeker implementation, September 1, 2026.
What we removed
The previous opportunity model reserved 10% for market buildability. That value came from generated idea content. It had no direct source evidence or independent recency model, so v3 sets the database field to null and removes it from the formula.
V3 also does not use the older volume, urgency, and specificity blend. Those values can remain in an idea's evidence summary for display and backward compatibility. They are not read by the v3 scoring function. The worker now refreshes the displayed volume from the count of independent qualifying signals, but the opportunity score uses the more precise quality, depth, and source-breadth inputs below.
This separation matters because generation and measurement answer different questions. AI can summarize a possible product. It cannot make its own summary into market evidence.
How a raw match becomes score evidence
A semantic match only says that a signal is related to an idea. It does not automatically earn score points. The worker applies a sequence of gates before a record can contribute to demand.
flowchart TB
  A[Signals matched<br/>to the idea] --> B{Current quality<br/>contract?}
  B -- No --> Z[Context only]
  B -- Yes --> C{Medium or high<br/>and above threshold?}
  C -- No --> Z
  C -- Yes --> D{Demand role?}
  D -- No: launch or enrichment --> Z
  D -- Yes --> E[Deduplicate by<br/>logical signal key]
  E --> F[Apply source identity<br/>and 60-day decay]
  F --> G[Select five strongest<br/>for signal quality]
  F --> H[Count effective signals<br/>and effective sources]
The funnel removes weak records, launch-only supply, search enrichment, non-accepted podcast context, and duplicate logical signals before scoring. It does not claim that excluded records are useless; they answer different research questions.
Qualifying demand roles are source-specific. Reddit and X records must represent demand rather than a launch. Job ads must contain responsibilities, workflow, product mission, job description, or operational pain. App reviews must contain a problem, feature request, workaround, switching event, or willingness-to-pay cue. Podcast evidence must pass its enforcement gate. Product launches and Google Trends records stay out of demand quality because they represent supply and search enrichment respectively.
Signal quality is continuous and recent
Each qualifying signal already has a source-specific weighted quality result. The v3 worker converts the distance above that source's threshold into a continuous base quality:
base quality = clamp(0.50 + 0.10 × (net quality − threshold), 0.50, 1.00)
A signal that barely clears its threshold begins at 0.50. Stronger evidence rises in 0.10 steps until it reaches 1.00. This preserves more information than treating every medium record alike and every high record alike.
The worker can then apply a bounded 20% boost when the record contains both an explicit commitment cue and a reputable-source cue. Examples include buying intent from an established community author or adoption intent from a tiered podcast source. The boost is capped at 1.00. Commitment without source reputation does not receive it, and reputation without commitment does not receive it.
Finally, age reduces the result with a 60-day half-life:
recency = 2 ^ (−age in days / 60)
adjusted quality = boosted base quality × recency
A signal observed today keeps all its weight. At 60 days it keeps half. At 120 days it keeps one quarter. Future timestamps are bounded at full weight instead of creating extra credit.
Depth and breadth are separate
Twenty observations from one person are not the same as twenty observations from twenty independent people or organizations. V3 therefore calculates evidence depth and source breadth separately.
First, duplicate logical signals collapse to the strongest record. The worker then sums the recency weights of the remaining records to get an effective signal count. Depth uses a logarithmic curve capped at ten:
depth = ln(1 + min(effective signals, 10)) / ln(11)
The logarithm gives the first few independent observations more value than the ninth and tenth. After ten effective recent signals, more records improve the evidence available for reading but do not keep inflating this component.
For breadth, the worker derives a source identity from the source payload:
- Reddit and X use the author identity.
- Job ads use the company.
- Podcasts use the feed plus speaker when both are present.
- App reviews use an author fingerprint or external review identifier.
Each identity contributes only its freshest qualifying signal's recency weight. The resulting effective source count uses the same log formula and cap. This is the source-quality dimension we wanted: not “podcasts count more than reviews,” but “how many independent, identifiable sources support the idea, and how current are they?” UK government evaluation guidance similarly treats convergence across multiple sources as stronger evidence while still checking disagreement and quality.
Search trends are context, not direct demand
Google Trends has its own 15% input. We compare recent median interest with a longer baseline, convert the ratio to a bounded momentum score around a neutral 0.50, and apply the 60-day recency weight to the snapshot.
We keep this separate from signal quality because search interest is not a complaint, request, buying commitment, or funded job. Google says Trends values are normalized relative interest on a 0–100 scale and recommends treating them as one data point among others. They are not absolute search counts and they are not polling data.
Competition rewards validation, then penalizes crowding
Competition is not a simple inverse count. Zero observed competitors earns zero competition-opportunity points because missing supply data should not look like an uncontested market.
Each active competitor with at least 0.70 match confidence contributes an effective fraction:
effective competitor = relationship weight × confidence × (0.50 + 0.50 × traction)
Direct competitors use a relationship weight of 1.00, substitutes 0.65, and adjacent products 0.35. Missing traction uses a neutral 0.50 rather than pretending the company has none.
The opportunity curve starts with a 0.35 baseline when competitor evidence exists. It rises as the effective count approaches three, then falls as the count approaches ten. Three effective competitors produce the highest validation result. Ten or more produce 0.30. This reflects a practical reading: some supply validates a market, while dense relevant supply makes entry harder.
Confidence is not part of the score
V3 reports score confidence beside the opportunity score, but does not multiply the two. Confidence describes evidence coverage:
confidence = 65% demand coverage + 15% trend coverage + 20% competition coverage
Demand coverage reaches full value at five effective recent signals. Trend coverage follows the recency and availability of a momentum snapshot. Competition coverage is present only when at least one confidence-qualified competitor exists.
Keeping the values separate avoids a common ambiguity. A score of 70 with 35% confidence means “promising measured inputs, thin coverage.” It does not mean a 24.5 score and it does not mean a 70% chance of success.
The new UI shows the arithmetic
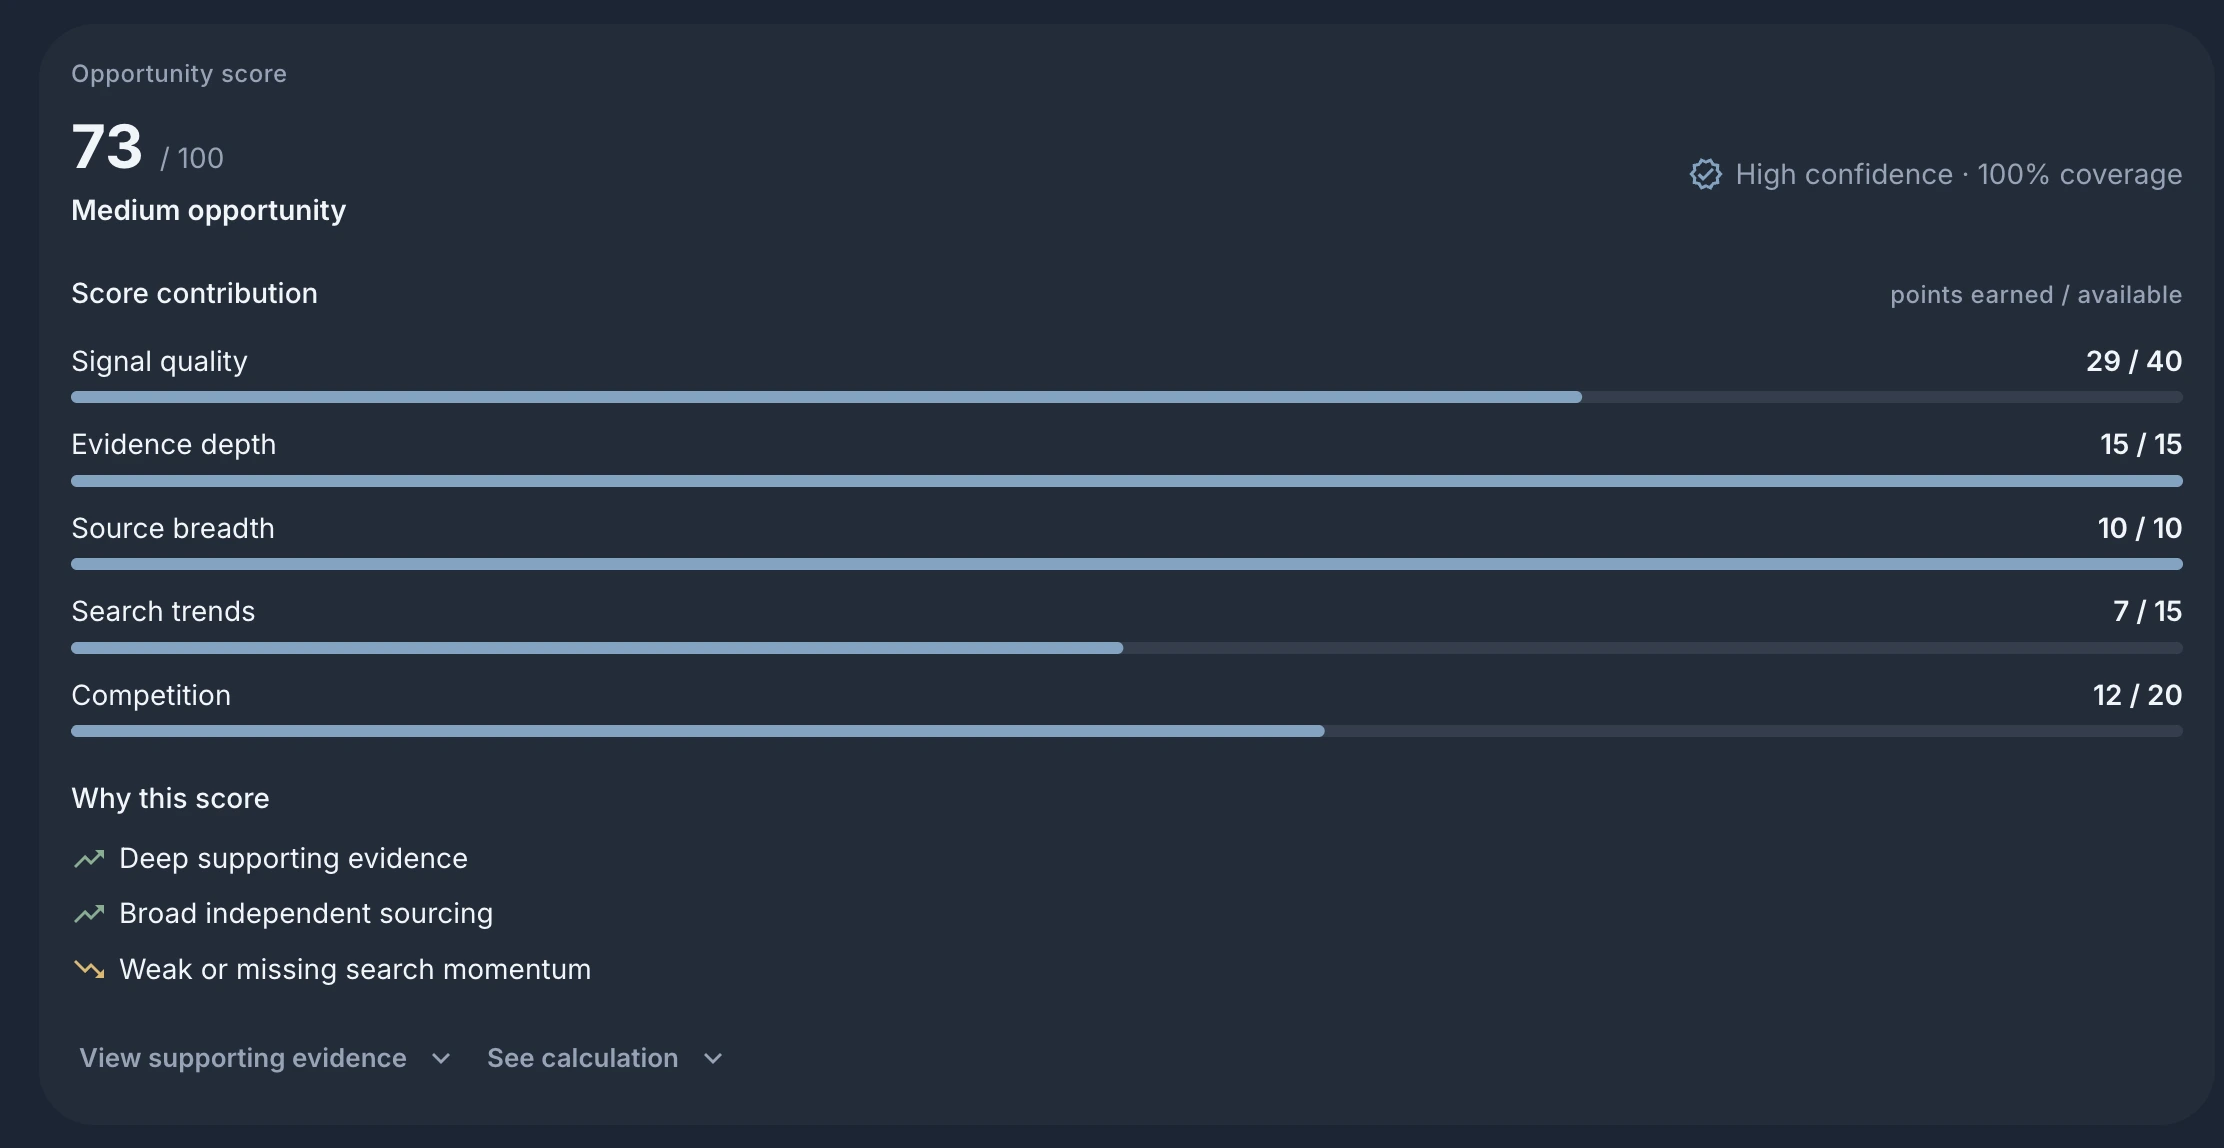
The compact card shows points earned out of the maximum for all five components. It also identifies the strongest and weakest measured inputs and reports confidence as coverage.
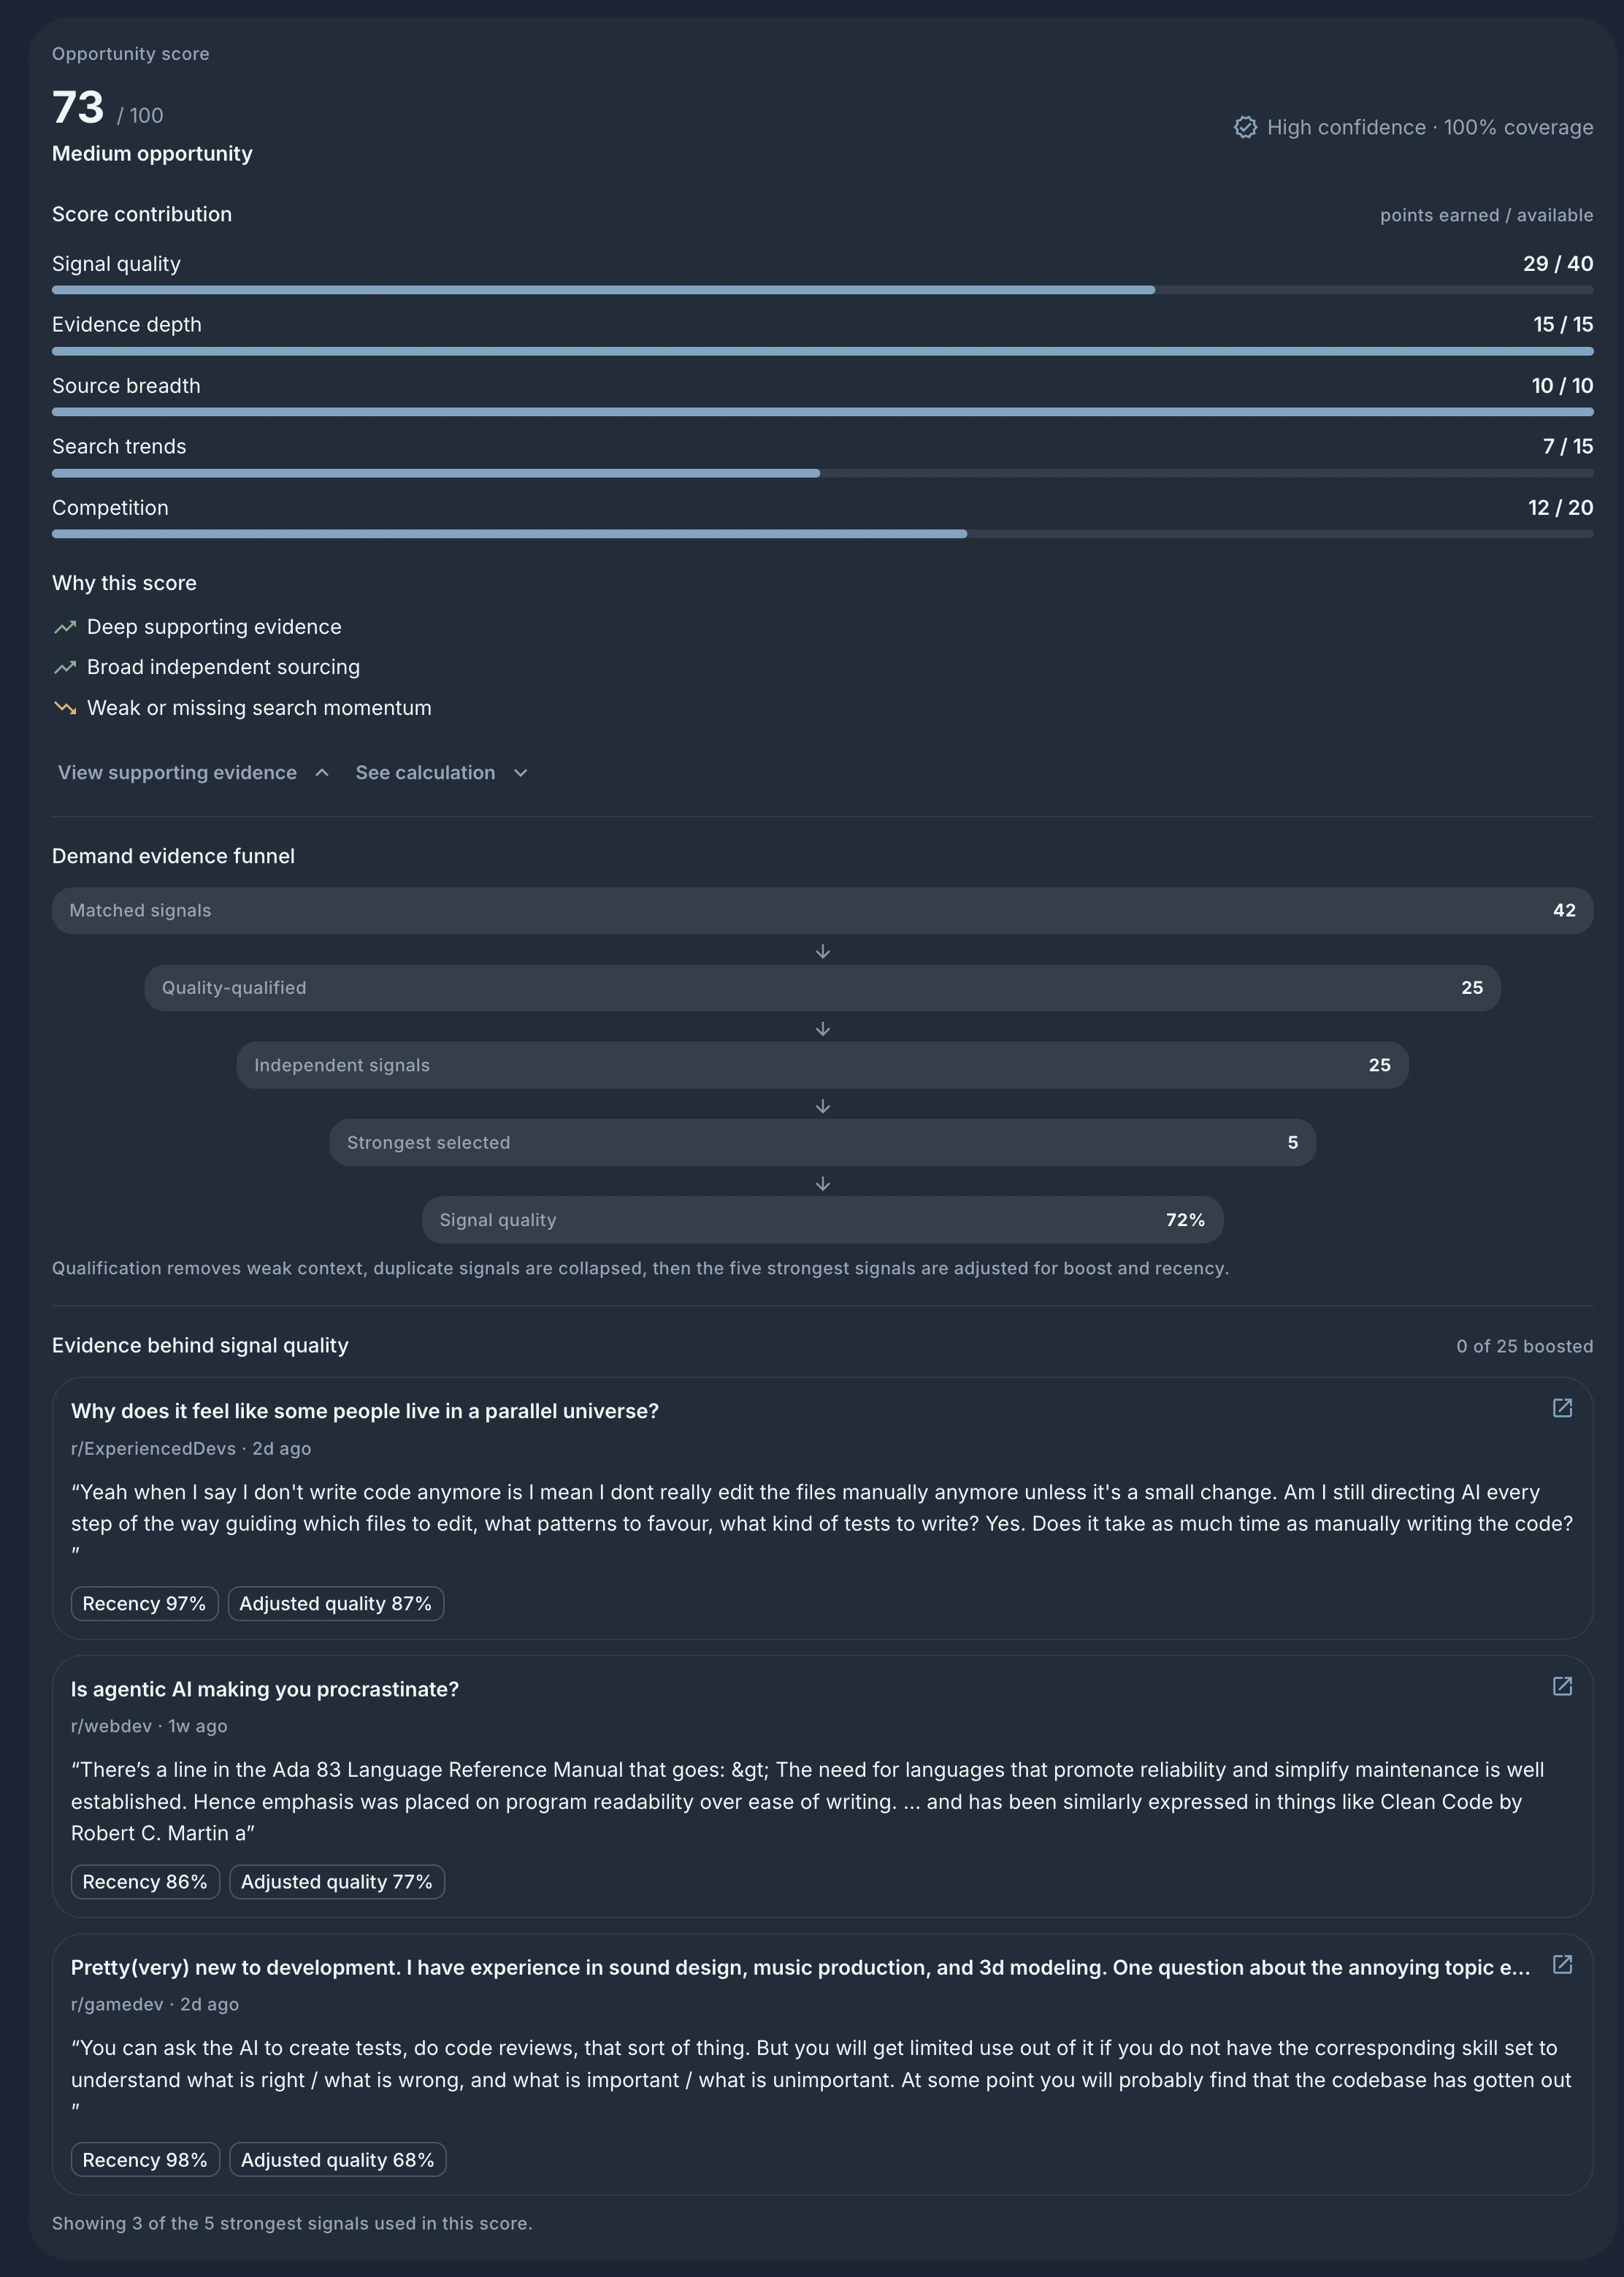
“View supporting evidence” opens the same funnel used by the worker. It shows how many matches qualified, how many independent records remained, and which five became the signal-quality sample. The first three selected records appear with source, observation date, recency, adjusted quality, and any bounded boost.
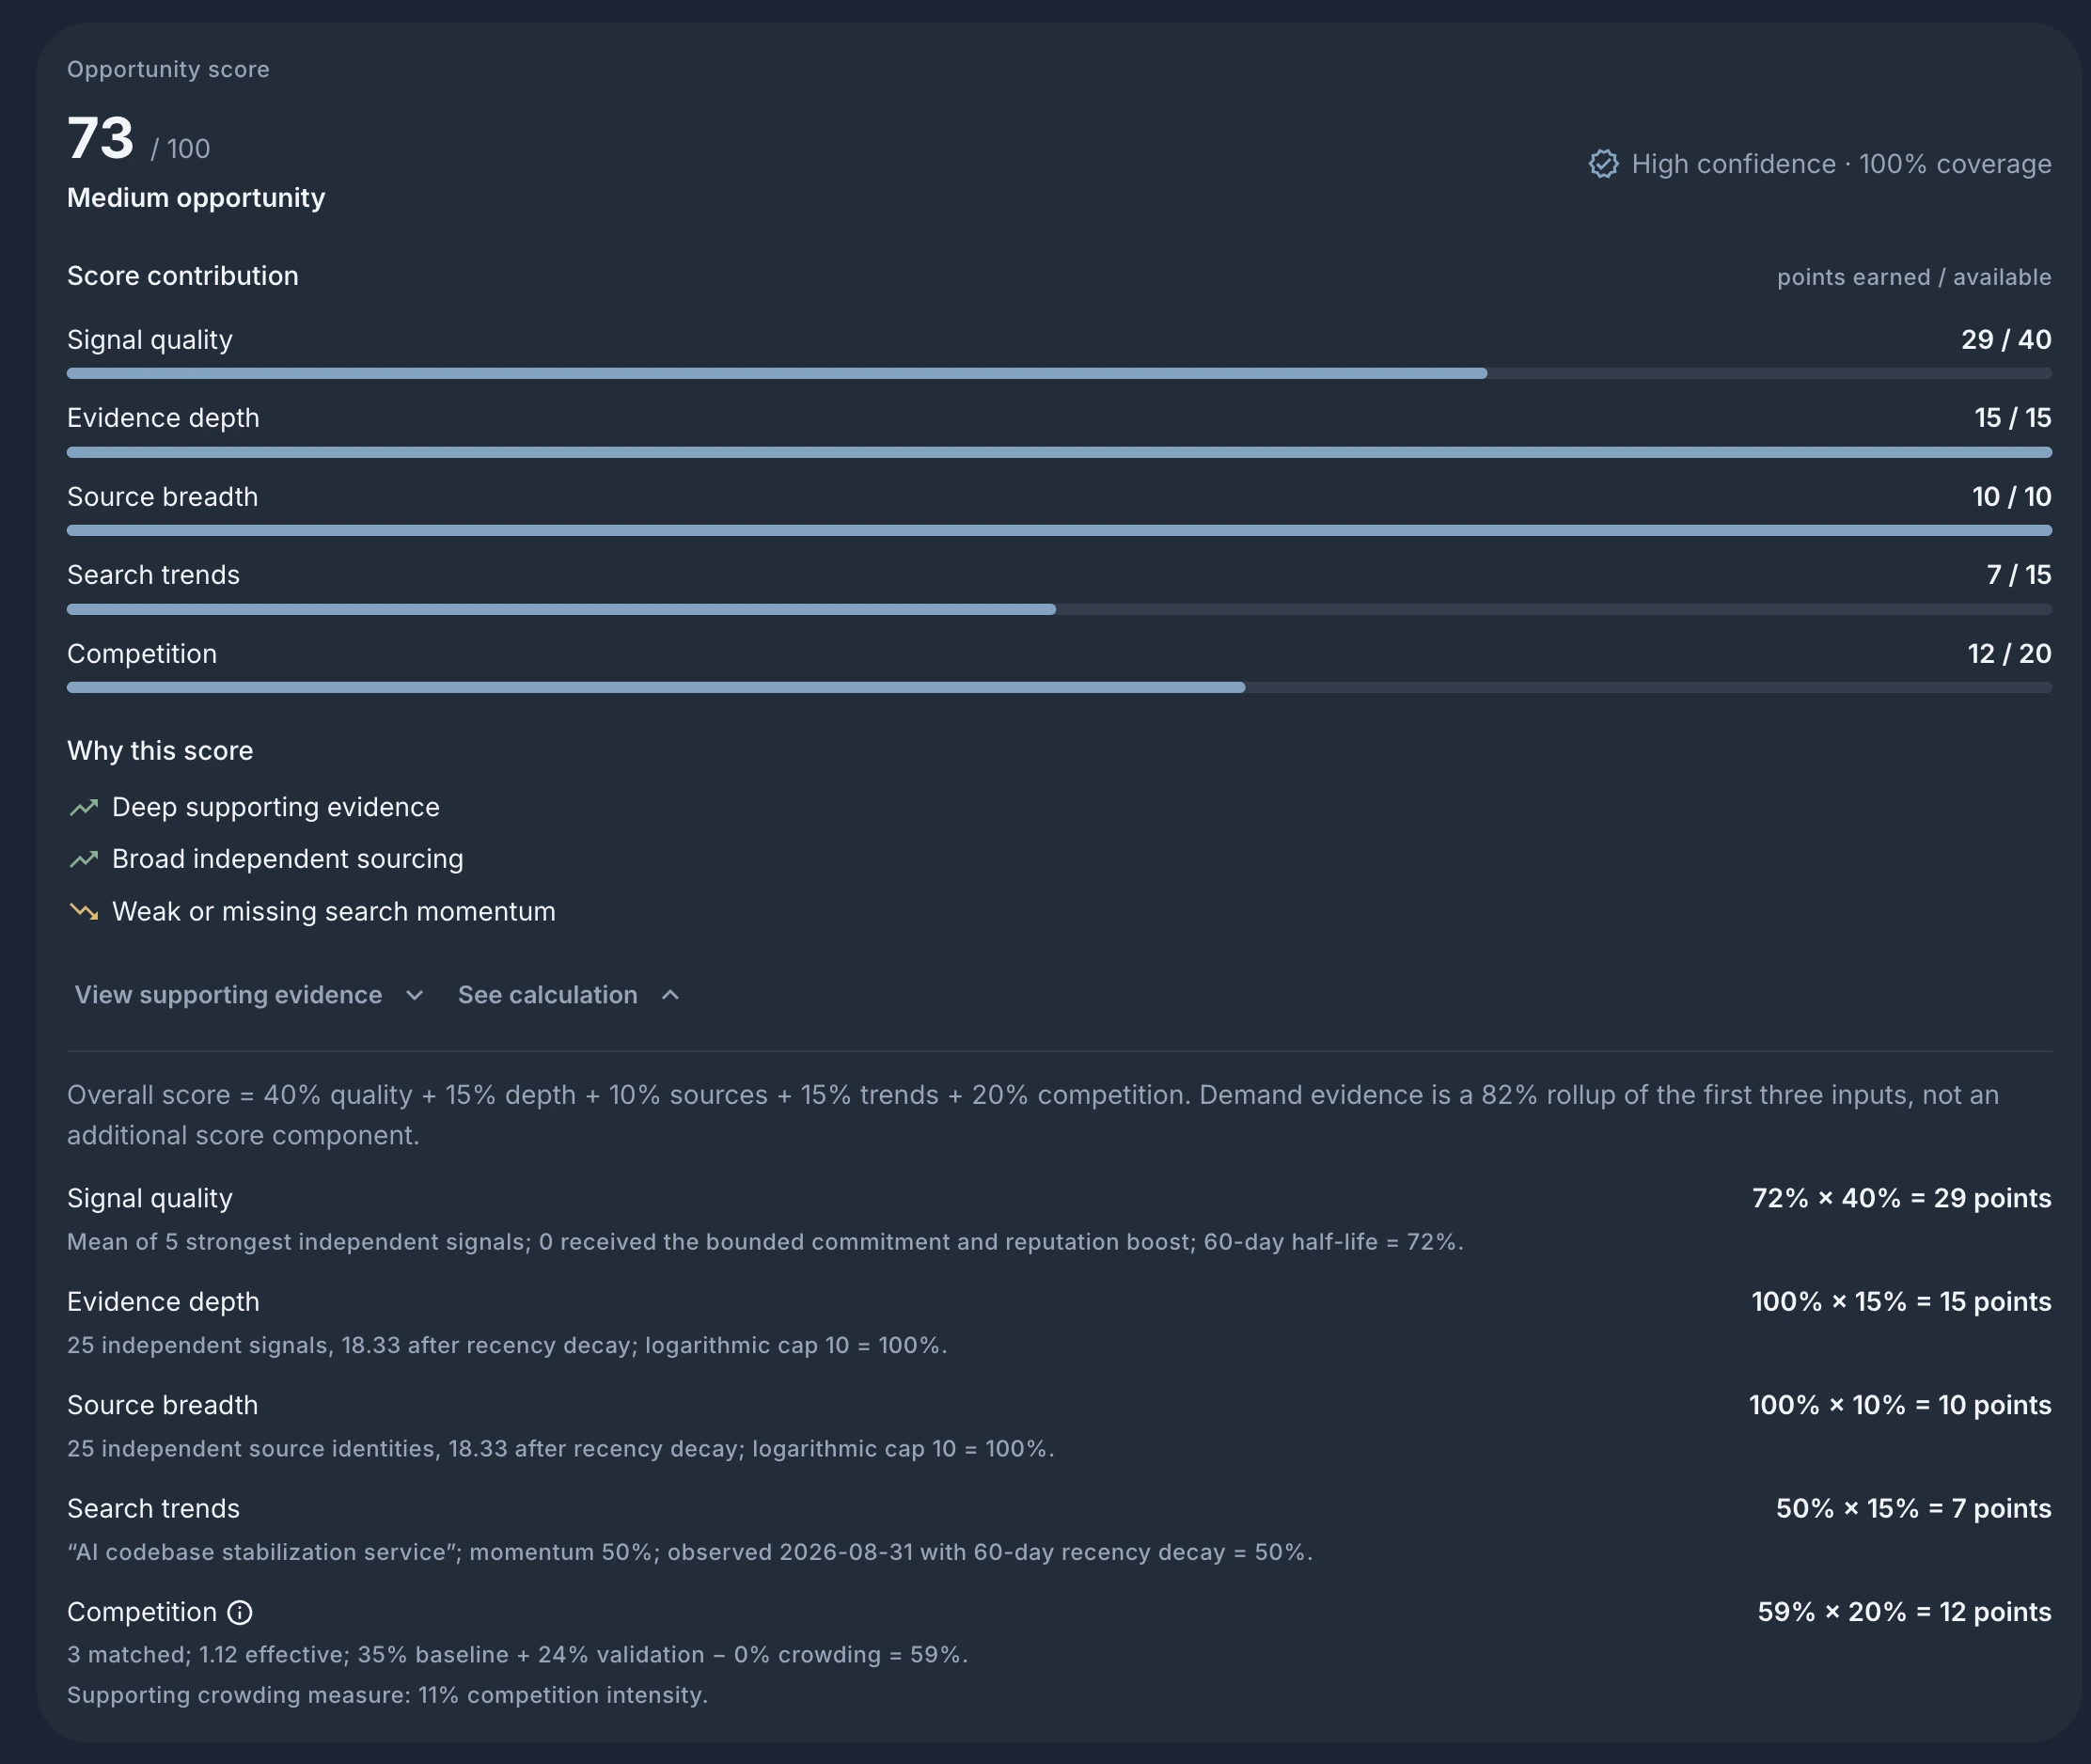
“See calculation” expands every component into its normalized value, weight, points, and data reference. Demand appears as a rollup of quality, depth, and breadth for readability. It is not added to the overall formula a second time.
What changed in production
At the September 1, 2026 snapshot used for this article, production contained 19,308 active v3 scores. The median was 0.3714 and the 90th percentile was 0.6303. All 19,744 legacy v2 rows were inactive. The row count can increase as eligible ideas enter the pipeline.
The lower distribution is expected. V3 no longer grants neutral or generated content easy points. An idea with no qualifying demand evidence, no current trend snapshot, and no observed competitors can score zero. That is more honest than filling missing measurements with a plausible midpoint.
| Behavior | Previous score | Opportunity Score v3 |
|---|---|---|
| Generated buildability | 10% input | Excluded |
| Demand | Aggregate evidence summary | Quality, depth, and source breadth from qualifying records |
| Missing evidence | Could receive neutral component values | Receives zero points and lower confidence |
| Source diversity | Not an opportunity-score input | Independent source identities, recency-adjusted |
| Explanation | Aggregate component labels | Weighted points, funnel, exact selected evidence, and formulas |
How to read the score
Use the score to decide which ideas deserve a closer read. Then inspect the attached sources, competitor set, search query, and confidence. A high score can still describe a market that does not fit your skills or distribution. A low-confidence score can change materially when coverage improves.
The score does not estimate market size, revenue, profitability, founder fit, execution quality, or the probability that a startup succeeds. It also cannot prove that every semantic match is relevant. The evidence disclosure exists so that a reader can challenge the inputs instead of trusting the aggregate.
For a practical workflow, open an idea from the Ideas page, inspect the score calculation, then read its idea-scoped signals. The market-signal research guide explains how to combine those views without treating one number as a decision.
Frequently Asked Questions
How is the Trend Seeker Opportunity Score calculated?
Opportunity Score v3 is 40% signal quality, 15% evidence depth, 10% independent source breadth, 15% search trends, and 20% competition opportunity. Each input is normalized from zero to one before weighting.
Does AI-generated market buildability affect the score?
No. Market buildability and first-pass AI judgments are excluded from Opportunity Score v3. The score uses observed evidence, search data, and confidence-qualified competitor records.
Do volume, urgency, and specificity still affect the score?
No. Legacy volume, urgency, and specificity fields can remain in an idea's evidence summary for display and compatibility, but v3 does not read them when calculating the opportunity score. Evidence volume is measured from independent, recency-adjusted qualifying signals instead.
What is source breadth?
Source breadth counts independent source identities rather than source categories. Depending on the source, an identity can be an author, company, podcast feed and speaker, or app-review fingerprint. Each identity contributes at most its freshest qualifying signal to the breadth calculation.
Why is confidence separate from the opportunity score?
The opportunity score estimates the strength of the measured opportunity. Confidence describes coverage: how much recency-adjusted demand evidence exists and whether trend and competitor data are present. A promising score with low coverage should trigger more research, not a stronger conclusion.
Ready to find your next business idea?
Explore validated business ideas backed by real user demand.