
Introducing Trends: Rising Search Demand, Matched to Real Evidence
Trend Seeker Trends ranks business topics by Google Trends growth and pairs each one with Reddit, podcast, and job-ad demand signals and the competitors already in the market.
6 min read
Introduction
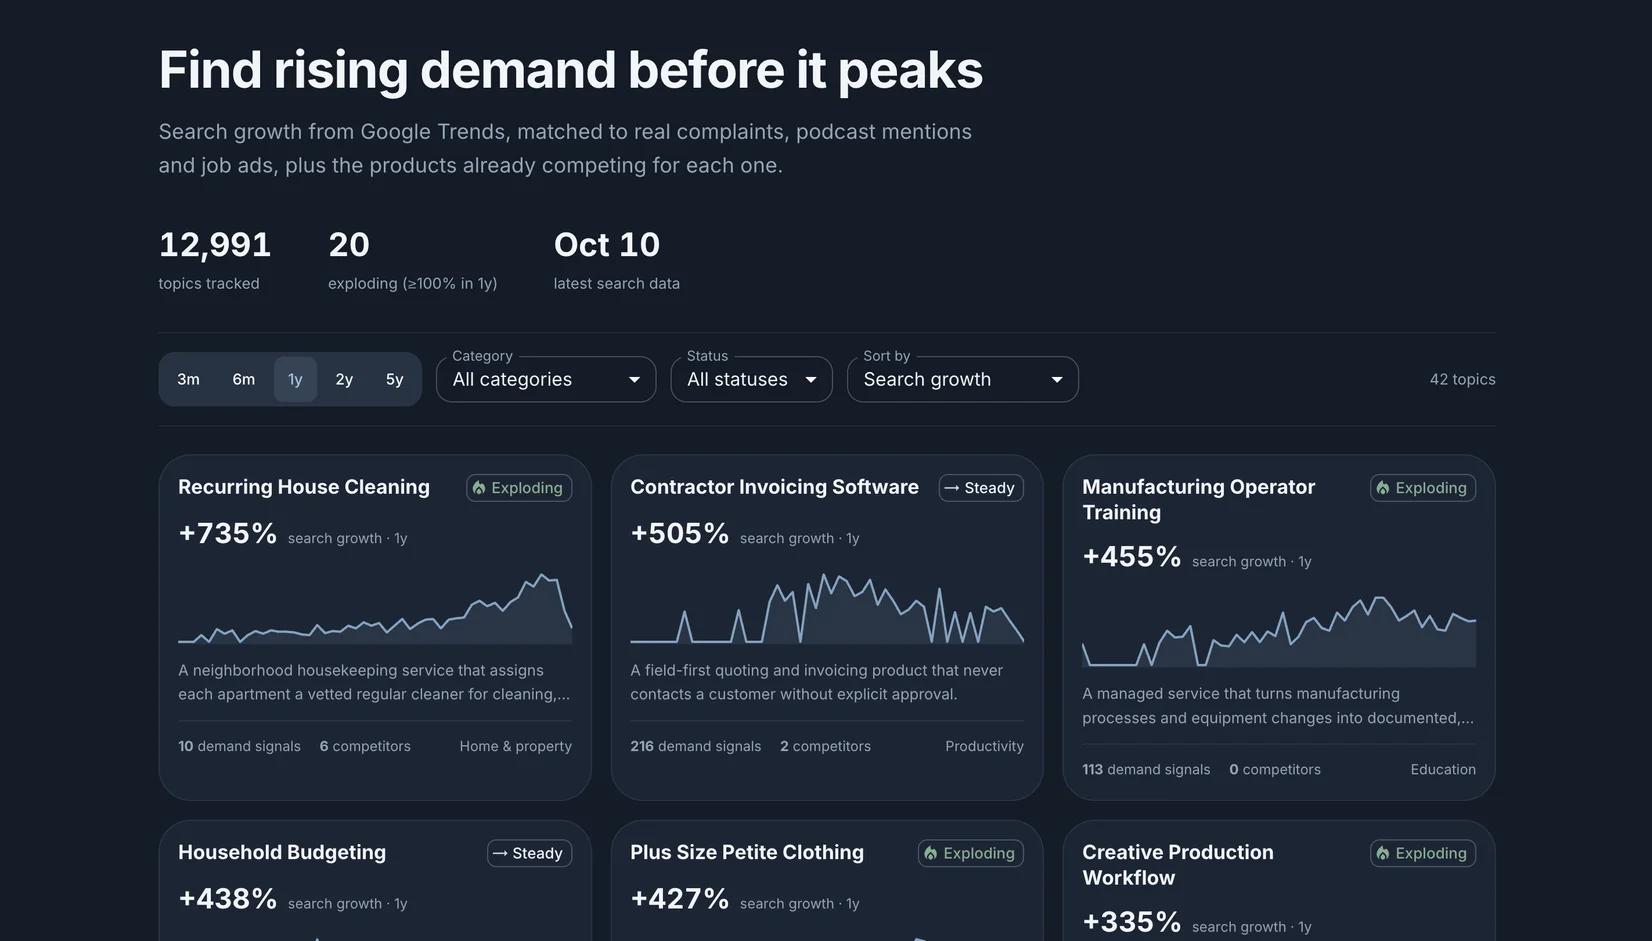
Trends is a new Trend Seeker page that ranks business topics by how fast their search interest is growing, then shows what people are saying about each one and who already sells into it. You can open it from the first link in the top menu or go straight to trend-seeker.app/trends.
A rising search curve is a useful first hint, but on its own it says little about whether there is a business behind it. Trend Seeker already collects demand signals from Reddit, podcasts, and job ads, and tracks competing products for each business idea. Trends puts the search curve next to that evidence, so you can see whether people are only curious or are actually describing a problem.
What's on the Page
The first release tracks 12,991 Google Trends queries attached to Trend Seeker business ideas. Of those, 2,901 have meaningful recent interest, at least one qualifying demand signal, and search data from the latest six weeks. Twenty of those topics currently qualify as exploding.
- Topic cards show the search term, growth for the selected timeframe, a status badge, a weekly sparkline, the related idea's one-line summary, and its demand-signal and competitor counts.
- Filters let you switch the growth timeframe, narrow by category or status, and sort by search growth, demand signals, opportunity gap, or competitor count.
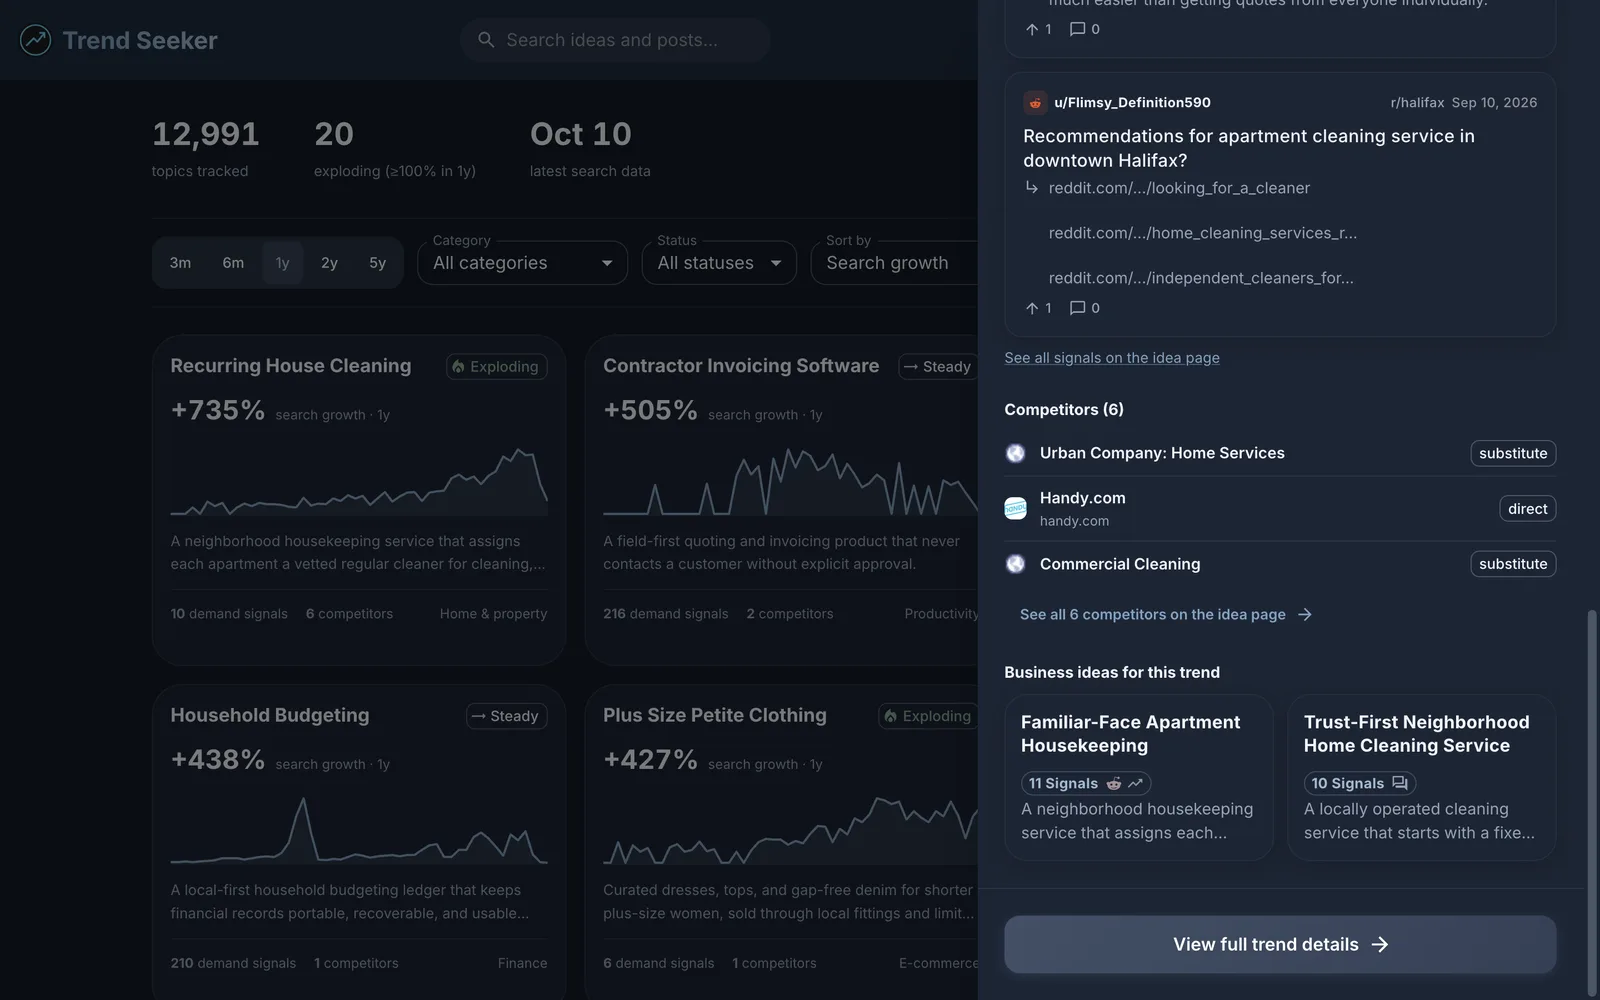
- The topic panel opens when you click a card. It shows growth across all five timeframes, an interactive Google Trends chart, signal counts by source, the latest demand signals with links to the originals, related searches, the tracked competitors, and business ideas built around the trend. Each topic also has its own page, linked from the panel.
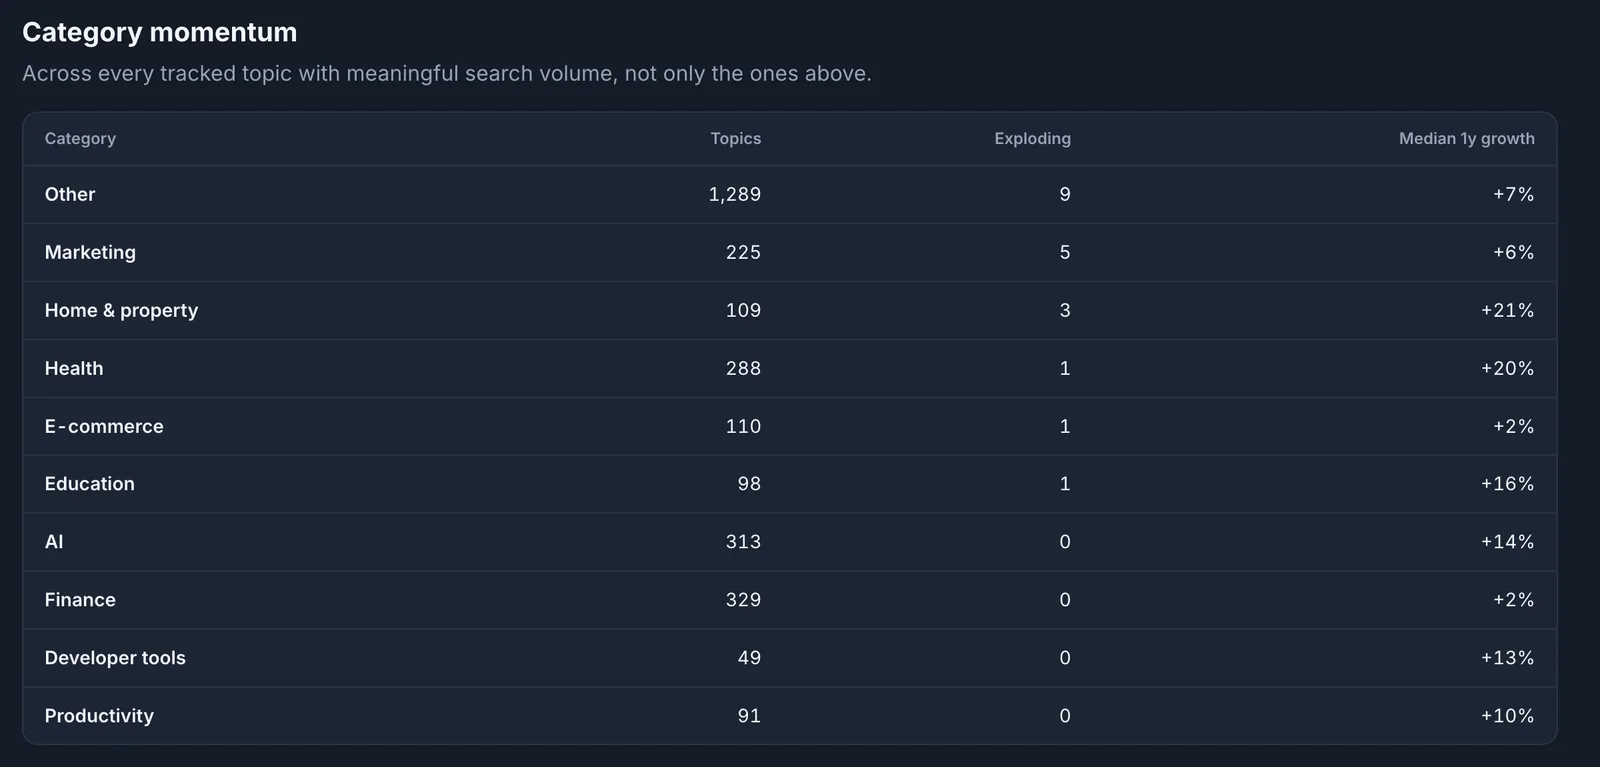
- Category momentum summarizes every eligible topic by category: how many there are, how many are exploding, and the median 1-year growth.
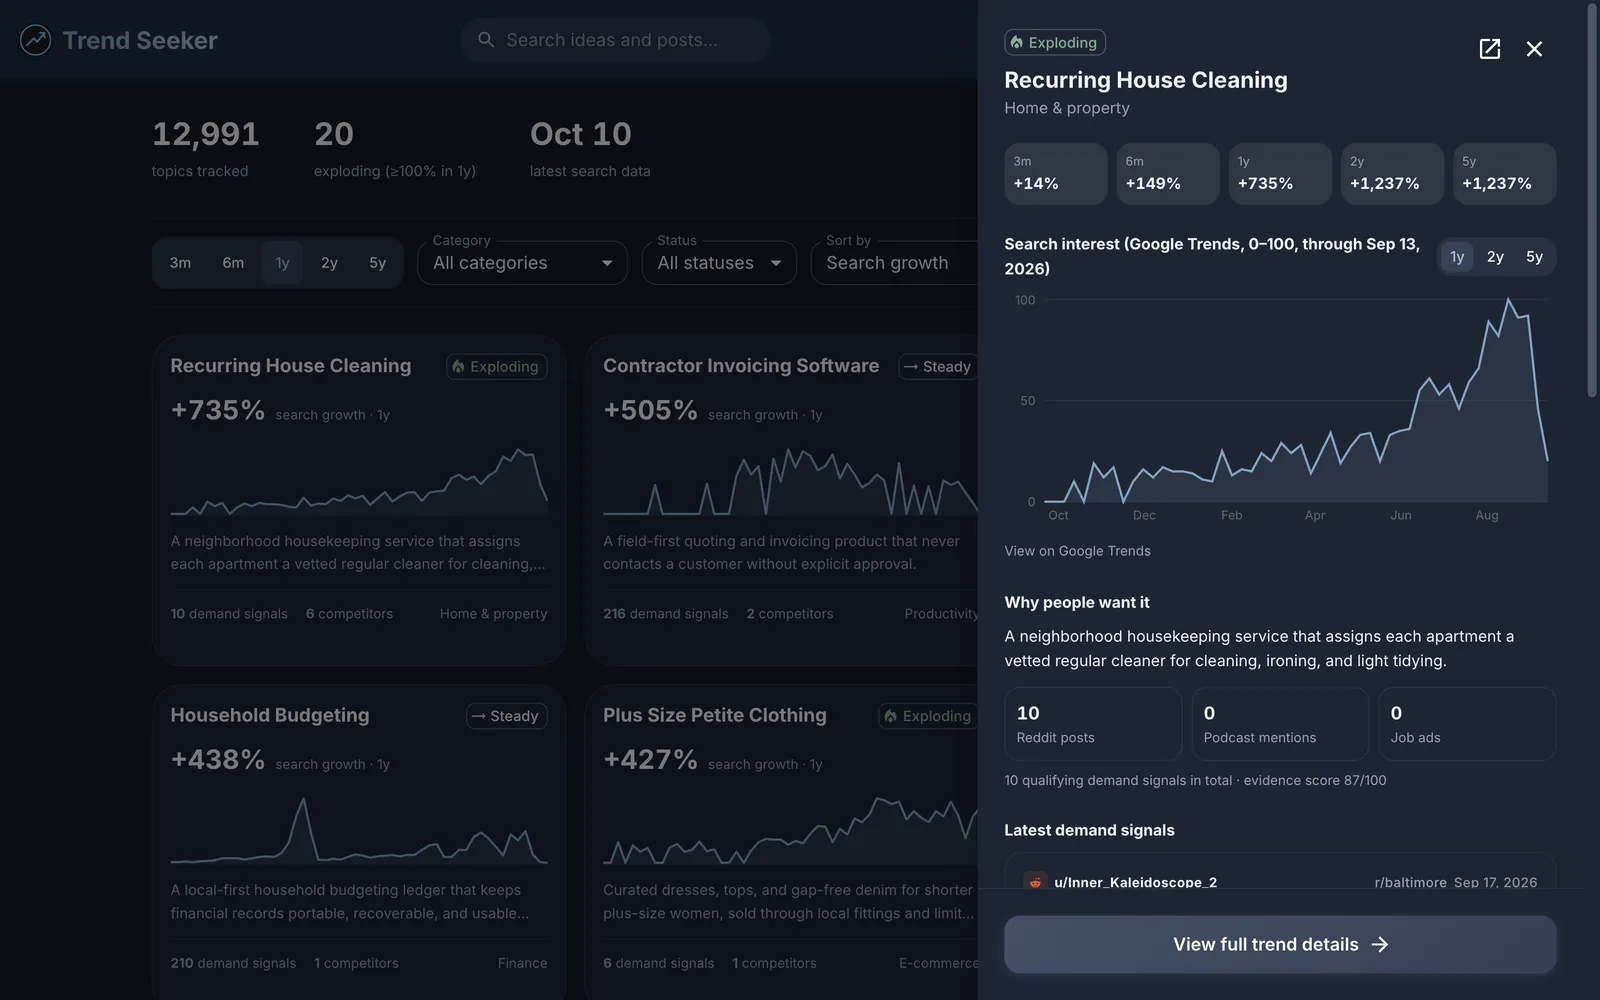
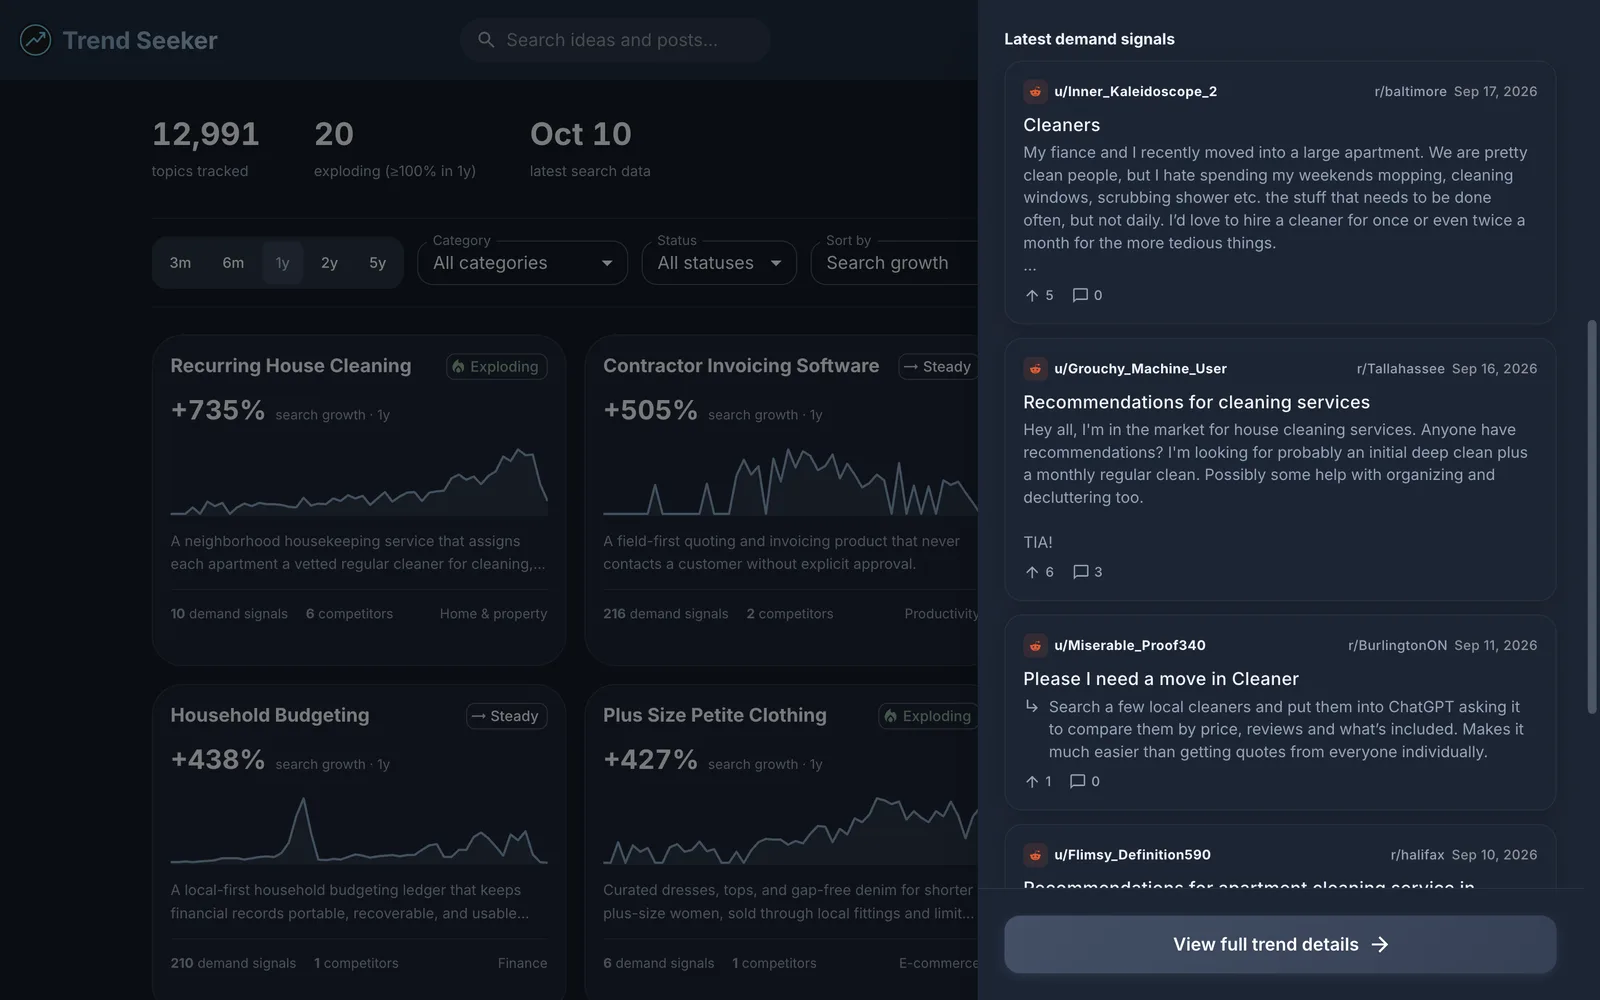
Further down, the panel lists the latest demand signals using the same signal cards as the idea pages. Each card opens the full signal with its source link.
Below the signals are the tracked competitors and the business ideas built around the trend. The button at the bottom opens the topic's full page.
How Growth Is Calculated
Google Trends data is noisy week to week and many business topics are seasonal. Comparing this week with the same week a year ago would turn holidays and school terms into fake trends. Trends uses averaged spans instead.
| Rule | What it does |
|---|---|
| Growth | The average of the latest 12 weeks compared with the same 12 weeks at the start of the window. The 3-month and 6-month views use 4-week spans. |
| Baseline floor | Starting interest counts as at least 5 out of 100, so a topic that went from almost nothing to modest interest doesn't show +6,000%. |
| Exploding | At least 100% growth over one year, with current interest still at 60% or more of the year's peak. |
| Peaked | The 1-year peak was more than 20 weeks ago, interest is now below 55% of it, and 1-year growth is negative. |
| Steady | Everything else. |
The baseline floor has one visible side effect. When a topic had near-zero interest both two and five years ago, both windows hit the same floor and show the same percentage. That is expected: neither window had a meaningful starting point.
Why There's No Search Volume
Google Trends reports relative interest on a 0 to 100 scale for each query. It does not publish monthly search counts, and any volume estimate built on top of it would be a guess. Trends doesn't invent one. The space a volume figure would take is used for two numbers Trend Seeker actually measures: qualifying demand signals and tracked competitors.
The opportunity gap sort combines them. It ranks topics with many demand signals relative to the number of competitors. Treat it as a prompt for research, not a verdict. In this snapshot, "home security cameras" has 633 demand signals and no tracked competitors. The market is obviously not empty. The zero means Trend Seeker's competitor data has a gap there, which is exactly the kind of thing you should check before acting on a ranking.
Examples from the First Snapshot
- Recurring house cleaning is the fastest grower in the current selection at +735% over one year, with six tracked competitors including Urban Company and Handy.
- Customer success operations is up 216% with 658 demand signals and only two tracked competitors, mostly from job ads describing the work.
- Manufacturing operator training is up 455% with 113 demand signals and no tracked competitors yet.
Each of these links goes to the topic's own page, where you can read the latest signals and follow them to the full business idea.
Free and Pro
Free accounts see the top 12 topics in the default 1-year view, sorted by search growth, along with the status filter and a few categories. Pro unlocks every topic and category, the 3-month, 6-month, 2-year, and 5-year views, the full 5-year chart, every tracked competitor, and the demand-signal and opportunity-gap sorts. See pricing for plan details.
Limitations
- Search snapshots refresh on a rolling schedule, so a topic's latest data point can be up to six weeks older than the newest one. Each chart shows its own end date.
- Categories are grouped from each idea's tags, and many topics still land in "Other".
- Low-interest queries look jagged because the charts show raw weekly values rather than smoothed lines.
- Some topics are seasonal even after the 12-week averaging, so check the 5-year chart before treating a spike as a trend.
Rising search interest helps you choose where to look. It doesn't prove anyone will pay. Read the signals, check the competitors, and talk to the people describing the problem. The market-signal research guide covers that process step by step.
Frequently Asked Questions
What does Trend Seeker Trends show?
Trends lists business topics whose Google Trends interest is rising. Each topic shows its growth over several timeframes, a weekly interest chart, the demand signals behind the related business idea, and the competitors Trend Seeker tracks for it.
How is search growth calculated?
Growth compares the average weekly Google Trends interest of the latest 12 weeks with the same 12 weeks at the start of the selected window. The 3-month and 6-month views use 4-week spans. Starting interest is floored at 5 out of 100 so near-zero baselines don't produce runaway percentages.
Why doesn't Trends show monthly search volume?
Google Trends reports relative interest on a 0 to 100 scale, not absolute searches. Instead of estimating a volume, Trends shows the number of qualifying demand signals and tracked competitors for each topic.
What is free and what needs Pro?
Free accounts see the top 12 topics in the 1-year view, sorted by search growth, and can filter by status and a few categories. Pro unlocks every topic and category, the 3-month, 6-month, 2-year, and 5-year views, the full 5-year chart, every tracked competitor, and the demand-signal and opportunity-gap sorts.